Visual Studio Macro for Attaching a Debugger to an ASP.NET process

Debugging web applications is a very common and repetitive task for any asp.net developer. At Velir, we generally choose to use IIS for debugging rather than the built in Visual Studio Development Server. We want to make sure our development environment closely mirrors our production environment and the differences between these two web servers are well documented.
Any developer that works on multiple web sites and uses IIS for debugging is familiar with the steps involved in attaching the Visual Studio debugger to the IIS worker process. The frustration begins to mount as you scroll through the long list of applications running on your computer and you find multiple w3wp.exe processes.

Macro Debugger Details
Presented with an opportunity to remove repetitive tasks and eliminate guess work, I set out to build a macro that would simplify web application debugging. The goal was to attach to the correct IIS worker process to the VS debugger in one click.
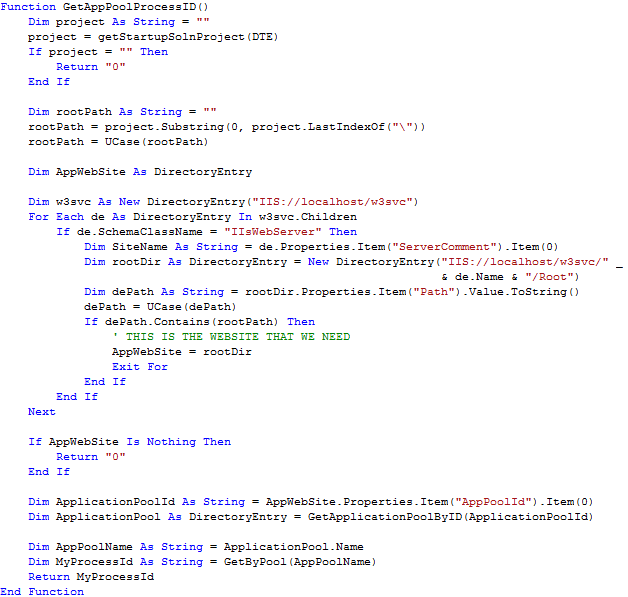
The key to this problem was learning about the DirectoryServices namespace, and its DirectoryEntry object. We can retrieve the World Wide Web Publishing service, or w3svc as a DirectoryEntry object.
Once we have the w3svc DirectoryEntry we can iterate over its collection of child entries that contain every website running under IIS. The macro matches the DirectoryEntry root path with the path of our solutions startup project. There is much more to the macro, but this excerpt is the core of the script.
Another handy feature I have built into the macro will disable the “Show All Files” property on all projects when debugging. We do this because Visual Studio has a problem debugging any asp.net application with a large number of files. At Velir we work on many Sitecore projects. Sitecore is a very powerful and capable CMS platform with an extensive web based management UI. This administrative UI is served from the same web application and contains thousands of code files and images. What we found is that Visual Studio will hang the second you hit debug if the “Show All Files” option is turned on. John West briefly describes this issue on his blog. And there you have it, a nice little macro to automatically detect the correct w3wp process to attach the debugger to.
Macro Setup
To setup this macro follow these steps.
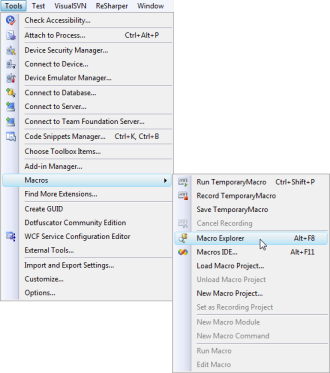
- Open the Macro Explorer
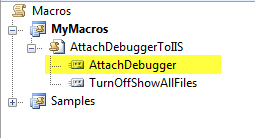
- Create a new Macro module and name it "AttachDebuggerToIIS". NOTE: If the File name is not the same as the module name, Visual Studio will not recognize it.
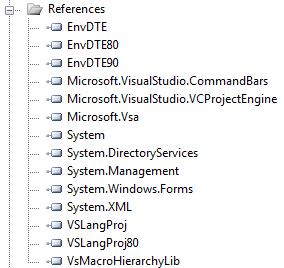
- Double Click to open the Macro editor, paste in the code. Then you will need to Add the proper references to the macro project to match this list.
- Once you have the macro created, you can run it to test. Fix any errors that might pop up (most likely a missing reference). Once it is running properly you can now assign it to a button or keyboard shortcut. The method you will want to use for your button or keyboard command is the "AttachDebugger" method.