

Analytics: Measuring What Matters

Humans have built-in cognitive biases. The most common one seen in business and marketing is confirmation bias. It’s remarkably easy to mine a stat or graph that gives the illusion of validation, implying that something is effective (or ineffective) based on a preconceived notion. There are industries full of people who have a vested interest in showing that something is influencing change, when it's really just a spurious correlation.
To truly measure the efficacy of your digital strategy you’ll want to step back from analytics reports and start thinking differently about measurement.
Let’s Talk About Measurement
In the digital age we have measurement systems capable of tracking millions of data points with relative ease. We also have powerful tools like Google Analytics that make data highly accessible to all. But what does all this data really tell us?
If we’re just viewing one metric all we have is a single value at a single point in time. If it’s the first time we’re observing that metric it’s virtually meaningless. We have no context for how it was derived or under what conditions. We have little knowledge about how it changed in relation to itself (or other things) over time, or which variables may have influenced that change.
Things get a lot more complicated when we start introducing thousands of other variables that may affect it, some of which are seemingly random. What factors are causative versus correlative, and which ones are merely coincidental? Not until we gather enough samples can we start to infer insights and even then we run the risk of reacting to anomalies and flawed data analysis.
Web Analytics are Diagnostics
Just like the gauges in your car, analytics tools can tell you what is happening but they tell you very little about why. If the check engine light in your car comes on it's telling you there’s a problem. But it doesn’t tell you precisely what the problem is and it certainly doesn’t tell you how to fix it. A technician first runs a series of diagnostic tests to confirm the symptoms and rule out false positives (like a broken sensor). Then a mechanic interprets the results and starts troubleshooting. You wouldn’t replace the engine just because the warning light turned on.
The same concept holds true for your digital strategy. We should never assert that we know exactly why something is happening based on web analytics reports. All those can tell us is what might be happening, which then leads you down a path of further analysis.
Your web analytics are really just diagnostics that can be used to formulate a defensible hypothesis, the results of which can be shared with others in a manner that is actionable or decidable.
Measuring Performance with KPIs
If you want to gauge your strategy’s performance you’ll need to go beyond web analytics and look to Key Performance Indicators (KPIs). You can google that for days but you’ll never find a definitive answer to what your KPIs should be. And that’s a good thing, because every organization should have proprietary KPIs that evolve over time. Before we dive into how to create meaningful KPIs, let's baseline the terminology and perspective we’re using here:
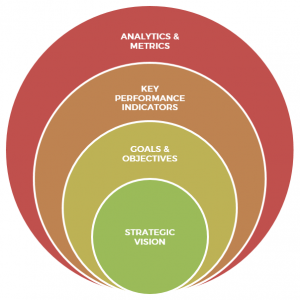
- Strategic Vision is the high-level view. It’s not very specific, but it’s clear enough to indicate a directional approach. Examples are things like “become the best at X”, or “enter a new market”.
- Goals are created in direct response to the strategic vision. They’re still a bit broad but they provide context as to the purpose of the strategy. They’re not overly prescriptive but they do narrow the lens on what areas will be focused on to fulfill the strategy.
- Objectives get more specific and are created in response to the goals. Objectives inform the tactics we’ll use and for how long. Objectives are the children of goals and have targeted outcomes that are easier to measure.
- Key Performance Indictors (KPIs) are metrics or measures that tell you how you’re performing in relation to your goals and objectives, which in turn inform the performance of your strategy.
- Analytics & Metrics are the observable measures and targets that can be quantified or discerned. Anything you can measure is a metric, but not all metrics are KPIs.
Goals inform KPIs but they’re not one and the same. Let’s say your strategic goal is to increase revenue. You might think that your only KPI is revenue, but what about all the activities you’re working on in support of it? Even if you observe a change in revenue you’re still left wondering why it changed and what to do about it. More importantly, you can’t measure the progress (i.e., performance) of your strategy while executing on your goals and objectives. Revenue is an important metric but that doesn’t mean it’s the right KPI.
No matter how perfect your KPIs might look on paper, their value is determined based on whether or not they’re influencing what you do next. If someone looks at a KPI and thinks “oh, that’s interesting” but isn’t compelled to act, then they either don’t understand the KPI or you’re measuring the wrong thing. These types of measurements are commonly referred to as vanity metrics.
How to Measure the Seemingly Immeasurable
A great approach to defining your KPIs is to start by asking questions about the things that matter most. Don’t worry about how you’ll get the answers yet. Just focus on what you’d expect to observe in your envisioned state of strategic success.
Focus on your goals first. This assumes that you’ve defined and set meaningful goals but for the sake of this article we’ll use a vague one that we often encounter with our clients: “Increase Engagement with our Audience”. Measuring that seems impossible at first. One thing is certain: looking at web analytics reports won’t provide the answers. Analytics play a role but they’re just one part of the equation.
Let’s first decompose “engagement” by asking some obvious questions (pretend we’re doing this on a whiteboard in a workshop). Be prepared: each question will often lead to even more questions, but you’ll typically complete this exercise in less than five rounds.
- What does engagement mean to us? It means that someone interacted with our digital content in a meaningful way
- Who is “someone”? A unique website visitor or social media promoter
- What is our “digital content”? Web pages on our domain, syndicated content we distribute to other websites, videos, or social media posts
- What does “interacted” in a “meaningful way” mean to us? It’s when someone: 1) accesses the content; 2) views it for a duration of time that indicates they consumed more than 75% of it; 3) shares or re-shares the content on social media, or; 4) submits a comment in response to the content
This is a brief example but it's demonstrative of how you'll continually get more specific with what you need to measure. Now we can create a list of metrics that we'll need to gather and track. From here you’ll want to start exploring plans for how you’ll get that data (some of it may require manual collection) and who will be responsible for it. Once we have the underlying inputs defined we can start constructing a measurement model. This is where science meets the art of measurement through a bit of abstract thinking.
Measuring Performance with an Index
This form of KPI measurement is a lot like creating an economic index. Indexes (or indices, if you’re a Latin major) consist of a variety of metrics that collectively roll up to a single indicator (like GDP or the Consumer Price Index).

Source: AZquotes.com
An index is not a perfect form of measurement. It’s initially used to derive a baseline (or nominal value). This value by itself is not meaningful, but when we measure its movement over time in relation to itself and other things, we can start to gauge performance.
Now you need to figure out how you’ll create your index. Using our “engagement” example above, we could come up with something like this:
E = U + S + C, where:
E = Engagement
U = Unique Visitors who view our content
S = Social Shares or Mentions (share count from Twitter, LinkedIn, Facebook, Medium) in response to our content
C = Number of comments in response to content
This is overly simplified to illustrate the concept. There’s a lot more you can (and should) do to refine this. First you’ll want to apply filters to each underlying metric based on your parameters (i.e., unique visits where visit duration is greater than 75% of X, where X is the scroll depth or benchmark time it would take someone to consume the content). Then you might want to apply weightings or some form of normalization to each input to balance things out, so that one of the higher volume values (like page views) don’t overly skew the index (unless you want it to).
You can then take it a step further by developing a basket of indexes that comprise a composite index, like the Philadelphia Enquirer did:
Σ(Ci + Di + Ri + Li + Bi + Ii + Pi), where:
Ci — Click Index: visits must have at least 6 page views, not counting photo galleries
Di — Duration Index: visits must have spent a minimum of 5 minutes on the site
Ri — Recency Index: visits that return daily
Li — Loyalty Index: visits that either are registered at the site or visit it at least three times a week
Bi — Brand Index: visits that come directly to the site by either bookmark or directly typing www.philly.com or come through search engines with keywords like “philly.com” or “inquirer”
Ii — Interaction Index: visits that interact with the site via commenting, forums, etc.
Pi — Participation Index: visits that participate on the site via sharing, uploading pics, stories, videos, etc.
Source: NiemanLab - Philly.com’s Seven-Part Equation for Measuring Online Engagement
This style of measurement is a lot more meaningful than having stakeholders glaze over thousands of web analytics metrics without any context or comprehension of what it all means in the aggregate. If you’re only using base analytics reports to measure your strategy, then your perspective will be much too narrow. Executives and decision makers don't care about pageviews or bounce rates, they just want to know if their strategy is working. They want inputs that help them decide whether they should stay the course, pivot, or pull the plug.
Start Measuring What Matters
Creating your performance measurement index takes some time and dedication but you have to start somewhere. Here are a few examples of index approaches to get your measurement ideas flowing:
- Philadelphia Enquirer’s “Reader Engagement Index”
- UpWorthy – Measuring Attention Minutes
- Analytics Demystified – Visitor Engagement Index
- Occam’s Razor – Digital Measurement Model
There are also some new and exciting developments underway, particularly in the art of measuring media impact:
Have you found a good approach to measuring the success of your digital efforts? Join the discussion and let us know what’s working for you.