

How to Make a Data Studio Dashboard

Harnessing the power of data to make smart decisions about your website is critical to its success. If you use Google Analytics as your site’s analytics platform, analyzing data can be challenging and time-consuming. This is especially true if your team is lean or if you don’t have a dedicated analytics expert. Luckily, in 2018 Google released a powerful and easy-to-use data visualization tool called Data Studio, which allows you to more efficiently and effectively leverage data to make better decisions.
What is Data Studio?
Data Studio is a free tool that turns your data into meaningful, easy to share, and fully customizable dashboards and reports. The benefits of using Data Studio as a data visualization tool are:
- It’s free to use
- It connects to a wide variety of data sources (both Google and third party connectors)
- It’s customizable – You can choose templates or create your own dashboards
- You can visualize multiple data points in one place instead of clicking through different reports in Google Analytics
- You can blend data from other sources, not just Google Analytics
- Your data updates automatically
Creating a Template

Data Studio a offers variety of templates depending on the type of data you want to analyze. You can edit those templates to pull in different dimensions or metrics. You can even edit their colors to match your brand. And if you’re not a fan of Data Studio’s templates, you can start with a blank slate by creating a template from scratch.
Connecting Data
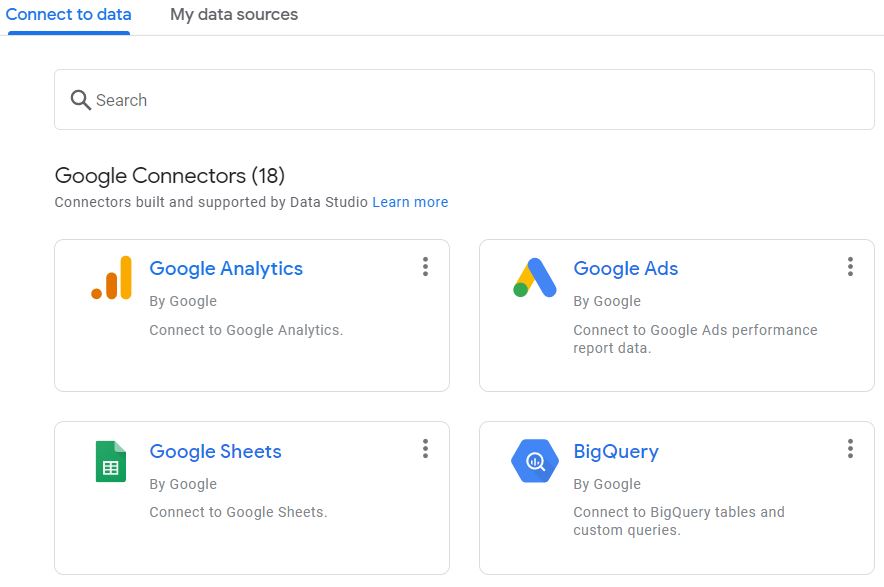
After choosing a template your next step is to connect data sources. Data Studio offers direct connections with many products in Google’s suite including Google Analytics, Google Sheets, and Google Big Query. Additionally, Data Studio offers a variety of connections to third-party sources, however, there are often costs associated with connecting to them.
One of the most useful features of Data Studio is the ability to blend data sources in one chart. Blending can reveal valuable relationships between your data sets. For example, many of our association clients blend data from Google Analytics and their Association Management System (AMS) through a third-party connector to understand what specific behaviors are most common among different membership types.
Building a Dashboard

Data Studio dashboards can be used to visualize many different data sets. We typically recommend using the tool to help monitor the health of your website and to measure its success through key conversions. Before creating a dashboard though, it’s important to that you create a measurement strategy. The purpose of a measurement strategy is to map specific conversions from your site to your business goals to understand if your site is performing as intended. Please reach out to Velir if you need help creating a measurement strategy.
To illustrate the importance of a measurement strategy for your Data Studio dashboard, we’ll try an example for associations. A typical goal for associations is to grow their membership base. To measure how successful the site is in doing that we would track successful member registrations as a key performance indicator. In the dashboard, we would set up visualizations to show the number of member registrations, the membership registrations rate, and different dimensions (such as source) to help understand what leads users to convert.
Analyzing and interpreting data can be a difficult and time-consuming task for web marketers. Data Studio helps to aggregate and visual your data in meaningful way to measure the success of your site and illuminate opportunities for optimization.
If you have additional questions about creating a Data Studio dashboard or need help creating a measurement strategy, contact us or learn more about our Analytics services.