

Developing for Performance: Sitecore and MiniProfiler

Often in software development, a great deal of time and emphasis is placed on gathering requirements, writing specifications, and developing software that meets those specifications. And rightly so. However, there are a number of requirements that are rarely written into specifications but expected, nonetheless. Website performance often falls into this classification. Great value and importance is placed on the performance of an application but sometimes it can be overlooked until it is too late. At Velir, we take a few measures to identify and address potential performance issues. MiniProfiler is key tool that can act as a first line of defense in identifying potential performance issues. In this post, I go over one way in which we use MiniProfiler to get detailed information about our Sitecore site.
MiniProfiler
MiniProfiler is a lightweight, extensible profiling tool that can be integrated into a .Net site very easily. On each page load, timing statistics will display in the upper righthand corner of the page.
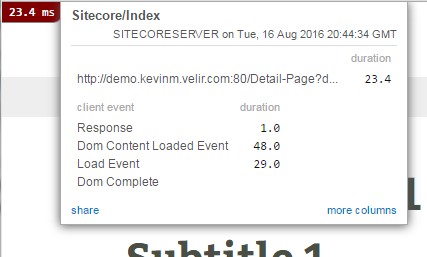
Once installed, we can quickly see in the upper left-hand corner of the page that it took 23.4 ms to load. And upon clicking the timing info, we can see a little bit more information about the request.
Installing
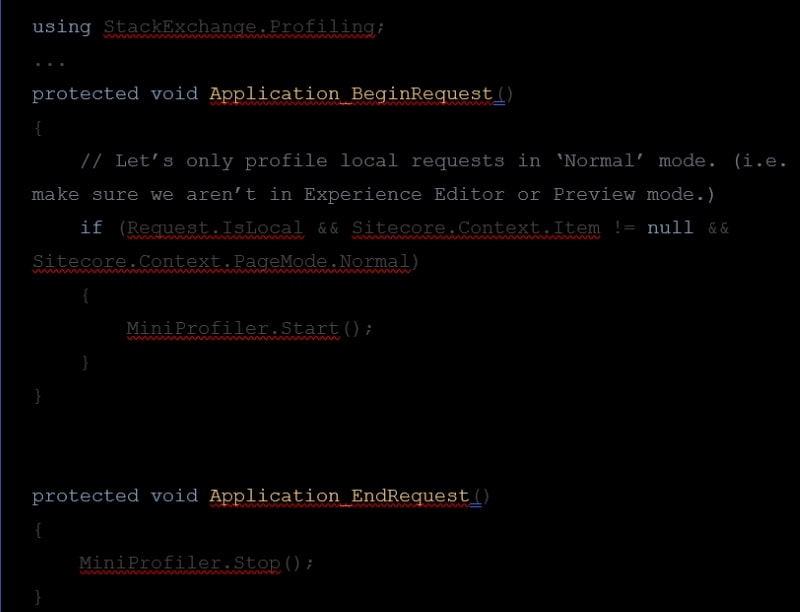
The barrier to entry on MiniProfiler is refreshingly low. Just install the MiniProfiler nuget package, then start and stop MiniProfiler from the Global.asax:
And render includes on your layout:
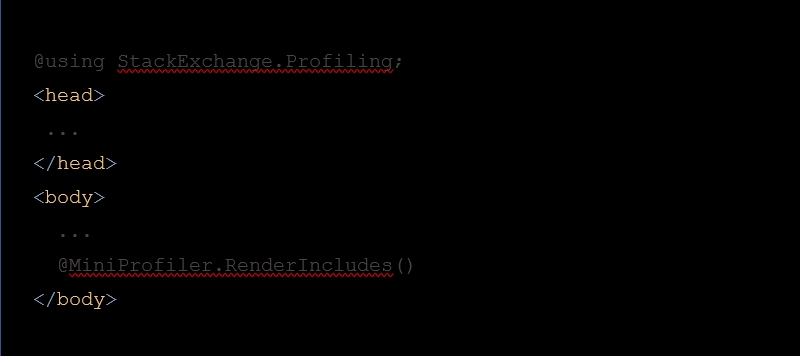
Now our requests will be profiled automatically.
Customizing
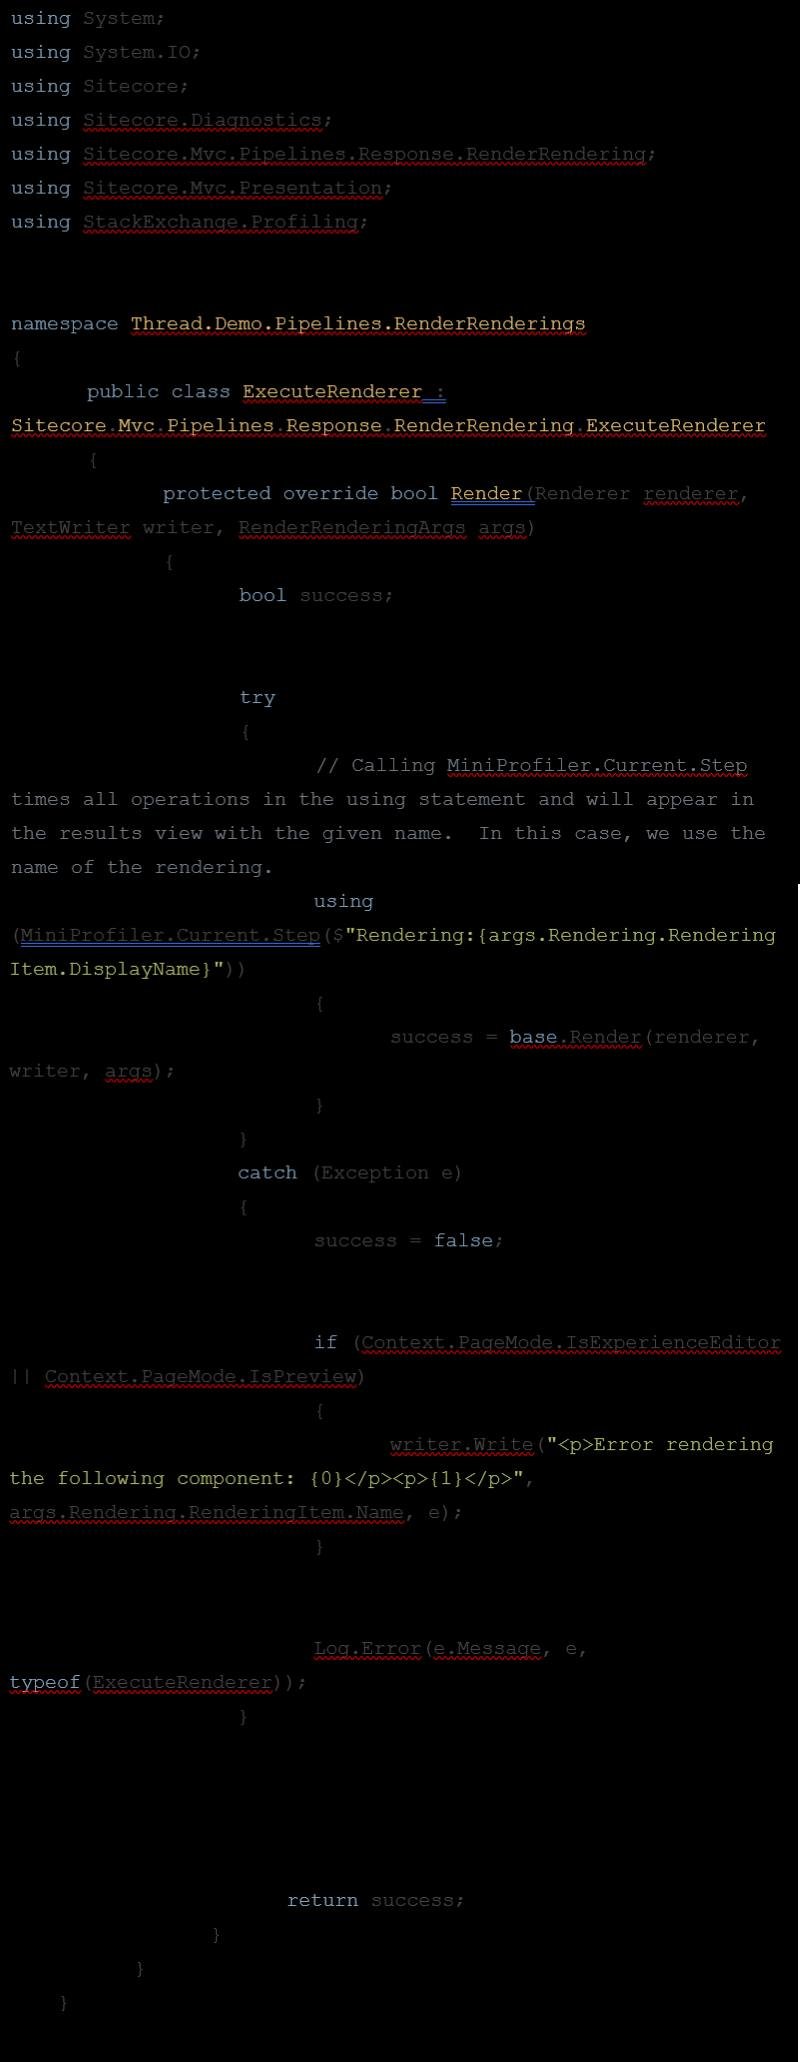
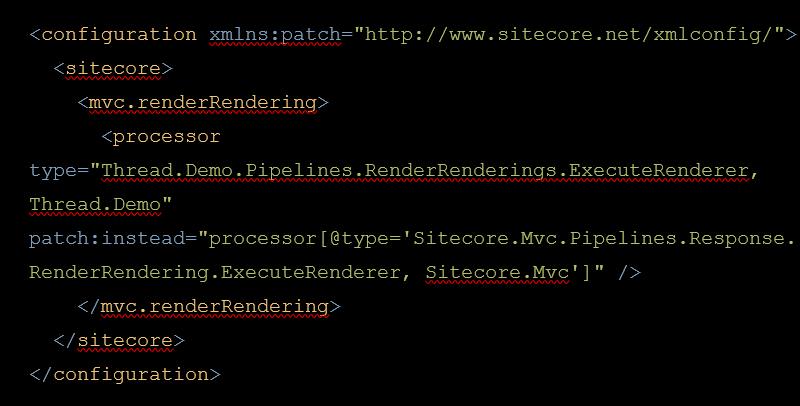
While knowing the page load speed and some of the other information provided by MiniProfiler out-of-the-box, it would be great to be able to see more detailed information. One easy customization we can make for Sitecore MVC sites is to extend the ExecuteRenderer processor in the mvc.renderRendering pipeline.
And then patch into our configuration:
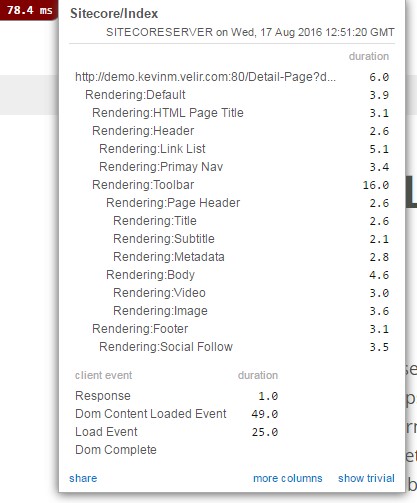
We can now see timing information in MiniProfiler for each Sitecore rendering.
Conclusion
As you can see, MiniProfiler’s API gives us the ability to display very relevant and valuable information to help identify potential performance bottlenecks. With this data displayed inline on the page, performance is kept in the forefront of the developer’s mind and the offending rendering or renderings can be identified immediately. For these reasons, MiniProfiler has become a part of our standard build for any new Sitecore environment.
Check back for part 2 where we’ll demonstrate how to leverage dependency injection for even deeper profiling with MiniProfiler.