

How to Track Sitecore Personalization with Google Analytics

Sitecore personalization enables you to give your audiences a better experience on your website by delivering them tailored and targeted content. Personalized content can be shown to your audiences based on their browsing history on your website and values such as their age, the date, or their location.
By default, Sitecore provides several reports that measure the impact of personalization on your site. While these reports are useful, clients have often asked whether this same data could be collected in Google Analytics alongside their existing web analytics and testing data. To accomplish that, Velir has developed the Sitecore Personalization Tracking module.
With this module, each impression of a personalized component is recorded in the data layer along with the component's name, the winning condition's name, the content path associated with the condition, and whether the component was hidden as a result. Once this data is in the page’s data layer, it becomes easy to push it up to Google Analytics using any Tag Management System such as Google Tag Manager. With personalization impression data in GA, marketers can better understand how their investment in personalization is influencing their visitors' behavior.
How This Works
The goal of the module is to allow Google Analytics users to create user segments based on whether any users were exposed to specific variants of personalized components. For example, a shoe retailer may want to view the conversion rate for users who received a personalized invitation to sign up for a discount.
To investigate how this works, we'll look at what’s captured from within Sitecore and how this information appears in Google Analytics.
Sitecore
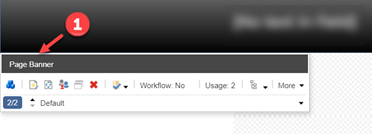
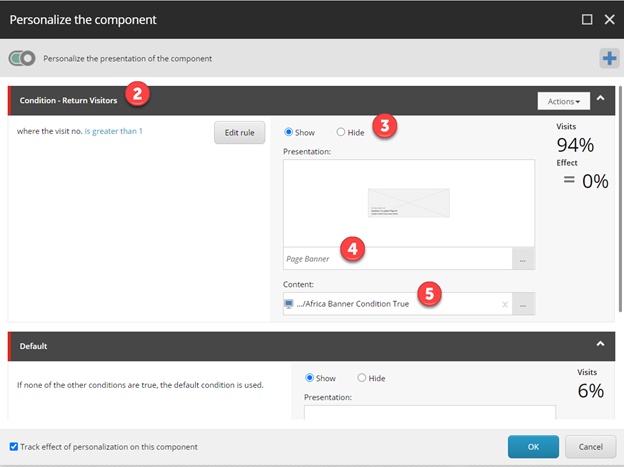
Once we have a personalized component in Sitecore, we’ll capture specific attributes described in the text and graphics below.
- Component Name pulls the name of the Sitecore component that's personalized.
- Condition Name pulls the name of the Sitecore condition used to personalize the component.
- Personalization State pulls the state (show/hide) of the personalization rule.
- Personalization Rendering pulls the Sitecore item path of the component’s rendering from Sitecore if the rendering is personalized.
- Personalization Content pulls the Sitecore item path of personalized content from Sitecore if the content has been personalized.
During the rendering of the personalized component, our module grabs these values and outputs them to the page’s data layer. Given that a single page may contain many personalized components, multiple sets of these values may be rendered. An example of how the data is formatted provided in the data layer is shown below:
window.dataLayer = window.dataLayer || [];

window.dataLayer.push({

'Event' : 'Personalized Component Impression',

 ‘Personalized Impression Data’: [ {

'Personalized Component' : '{{Component Name}}',

'Personalization Condition' : '{{Condition Name}}',

'Personalization Content' : '{{Personalization Content}}',

'Personalization Rendering' : '{{Personalization Rendering}}',

'Personalization State' : '{{Personalization State}}' }]

});
Google Analytics
If you’re using Google Tag Manager, pushing the data described above into Google Analytics is straight-forward. All that’s required are variables for each of the parameters listed above, a trigger that listens for the “Personalized Component Impression” data, and a tag that sends the data to Google Analytics.
With this configured, we’re ready to report on topics such as the following:
- Number of users exposed to personalized components - including the component names
- Number of users that clicked on personalized components - including the component names
- Specific pages the personalized components were on when they were viewed or clicked
- Session-based metrics (such as goal conversions) to compare between users who received specific personalizations and those who did not
- The content that was displayed to users who received a specific personalization variant
Here’s how the data appears in Google Analytics
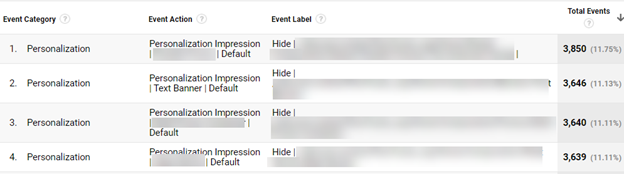
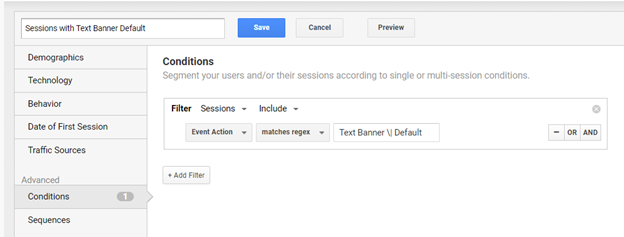
However, what’s more interesting than looking at the number of impressions is looking at data segmented by personalization impressions. This can be done through GA's segmentation tool. The example below creates a segment of users who received the “Default” variant of the “Text Banner” component.
Conclusion
Interested in tracking Sitecore personalization in Google Analytics? Be sure to reach out and mention the Sitecore Personalization Tracking module. You can also learn more we can help you activate Sitecore personalization data with our Data Activation and Integration Services, or watch this video from our Public Interface series, where we talk about Data Integration and Activation.